
How Much is Too Much?
As we discussed in Chapter 2, we live in a country that has a representative form of government in which, ultimately, power is vested in the people. We also employ a market economy where individuals have ownership of enterprises, but government retains a degree of economic planning and state-directed activity.
Here’s the rub. We have had a running battle in this country for well over 150 years about how much government we want in our lives. For example, unless you’re an anarchist or a pacifist, you’re most likely quite happy to permit the government to assume the defense of the country. Where the issue causes heated debates, however, is over how much government we’ll permit in the economy.
The issue has come to blows over who deserves to capture the value created by the enterprises operating in the market economy. At its core the organized labor movement was all about gaining what its advocates considered to be a more equitable share of the value created by the enterprise. The owners of the enterprise, however, believed the lion’s share of the value belongs to the investors of capital. Their confrontation surrounding this struggle is covered in blood.
At the next social function you attend, mention you’re in favor of more regulation of business and higher corporate income taxes. Or perhaps you might want to take the opposite position. No matter which position you take, you’ll likely find yourself in a heated debate, and I’ll handicap the time it will take to get there at thirty seconds.
Let’s take a look at the facts surrounding the most pressing economic issue of our time. In Chapter 1 we constructed an argument, supported by a great deal of evidence, that The Great Recession plus two wars may be just about equal to The Great Depression plus WWII in terms of impact on the federal budget and national debt. As a result, the 2012 presidential election could possibly be the most important election of our lifetime.
Just presenting the facts is likely to cause your blood pressure to reach the danger zone. Consider the chart below, which shows national debt as a percentage of GDP on the left axis (blue line) and budget deficits as a percentage of GDP on the right axis (red bars).
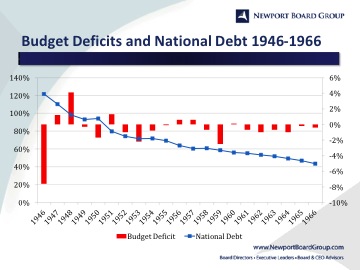
The chart is telling us our national debt, measured in terms of percent to GDP (left axis, blue line), declined steadily over the 21 year period following WWII from 121.7% to 43.5% of GDP, while we incurred budget deficits (right axis, red bars) in 15 of those 21 years. As a bit of an aside, our national debt reached its nadir in 1982 at 32.5% of GDP. No sparks there. Let’s go to the next chart, which, I assure you, you will not like.
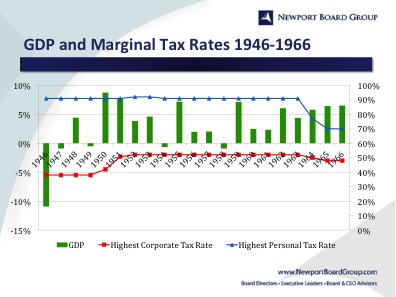
The left axis (green bars) shows the growth in GDP over the 21 years following WWII. It grew in 16 out of those 21 years. In point of fact the economy almost doubled over the period 1946 through 1966. The right axis is where all the controversy resides. It’s saying the highest personal income tax bracket (blue line) during 18 of the 21 years was 90% or above, and it dropped to only 70% by 1966. Over the same period the corporate income tax (red line) was raised from 38% to 50% in two steps and remained over 50% for 14 years. It dropped to 48% in 1965 and remained there in 1966. The highest personal tax rate and the highest corporate tax rate are now 35%. Please don’t be either so incensed or so frightened that you stop reading. We have two more charts to show you.
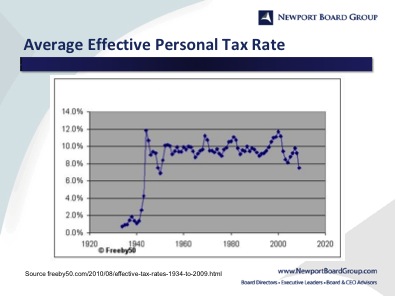
The average effective tax rate is the amount of total taxes actually collected divided by the total taxable income no matter any particular individual’s tax bracket. The chart is saying that despite the fact that in 2009 the highest personal tax bracket was 35%, our country collected in taxes less than 8% of total personal taxable income, the lowest level since the 1950’s. The country reached the highest average effective tax rate in 1945 and again in 2000 at about 12%. The next chart makes the same point in a slightly different way:

This chart shows federal receipts as a percent of GDP. In 2011 federal taxation declined to 15.4% of GDP. That’s the lowest level in about 60 years. In fact, total receipts as a share of gross domestic product has now been close to 15 percent for three straight years, the first time that has happened since before WWII. We paid for WWII with tax receipts in the area of slightly short of 17.5% of GDP. The data suggest we may need greater receipts than we’ve been collecting to pay for the Great Recession and two wars. It may be that the only question is from whose pocket will we take the money? Don’t shoot the messenger!!!
Sources: taxfoundation.org; irs.gov; americanprogress.org; bea.gov; CNN Money; Wikipedia.com; US Bureau of Economic Analysis; U.S. Bureau of Labor Statistics; U.S. Bureau of the Census; tradingeconomics.com; whitehouse.gov; scribd.com; elections.gmu.edu; trace.tennessee.edu/.


